JZ
J. Zimmerman & Co. · Financial Partner · Operator Advisor
Rental Portfolio Report
Sample data · figures are illustrative
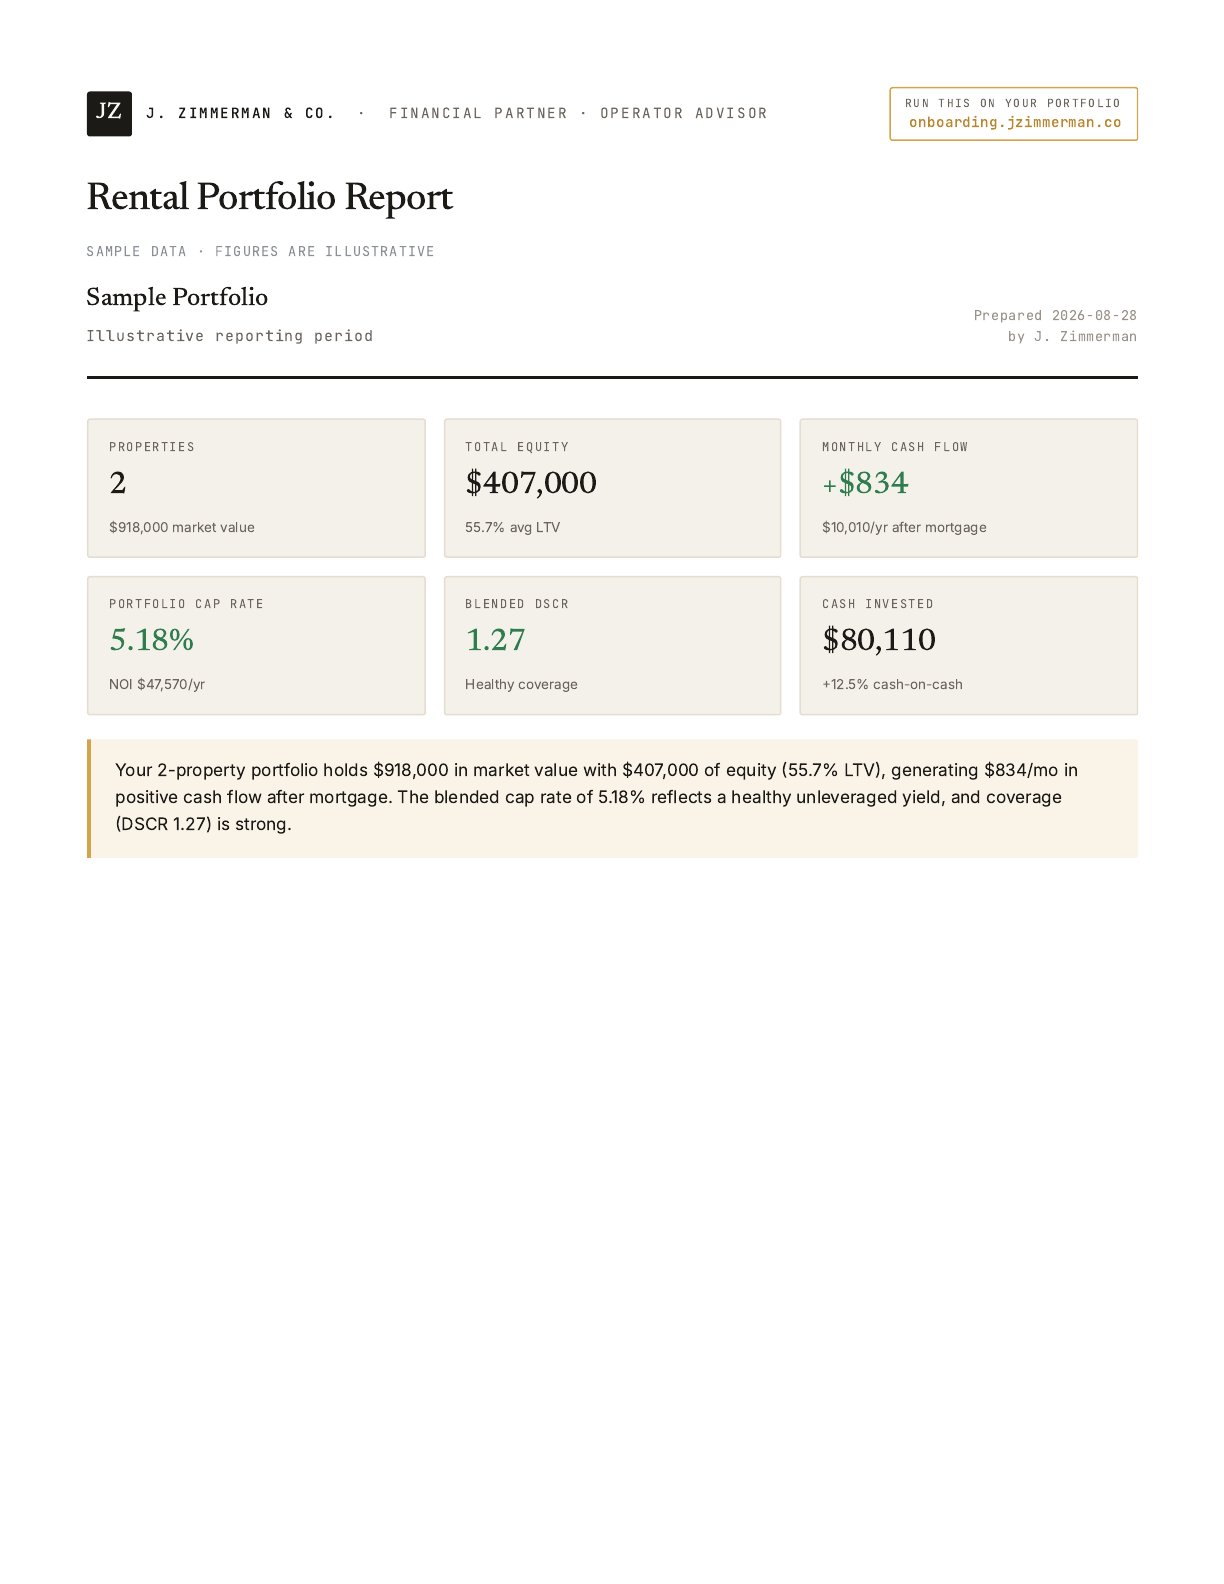
Properties
2
$875,000 market value
Total Equity
$275,000
68.6% avg LTV
Monthly Cash Flow
+$542
$6,500/yr after mortgage
Portfolio Cap Rate
5.60%
NOI $49,000/yr
Blended DSCR
1.14
Adequate
Cash Invested
$96,000
+6.8% cash-on-cash
Your 2-property portfolio holds $875,000 in market value with $275,000 of equity (68.6% LTV), generating $542/mo in positive cash flow after mortgage. The blended cap rate of 5.60% reflects a healthy unleveraged yield, and coverage (DSCR 1.14) is adequate.
Analysis
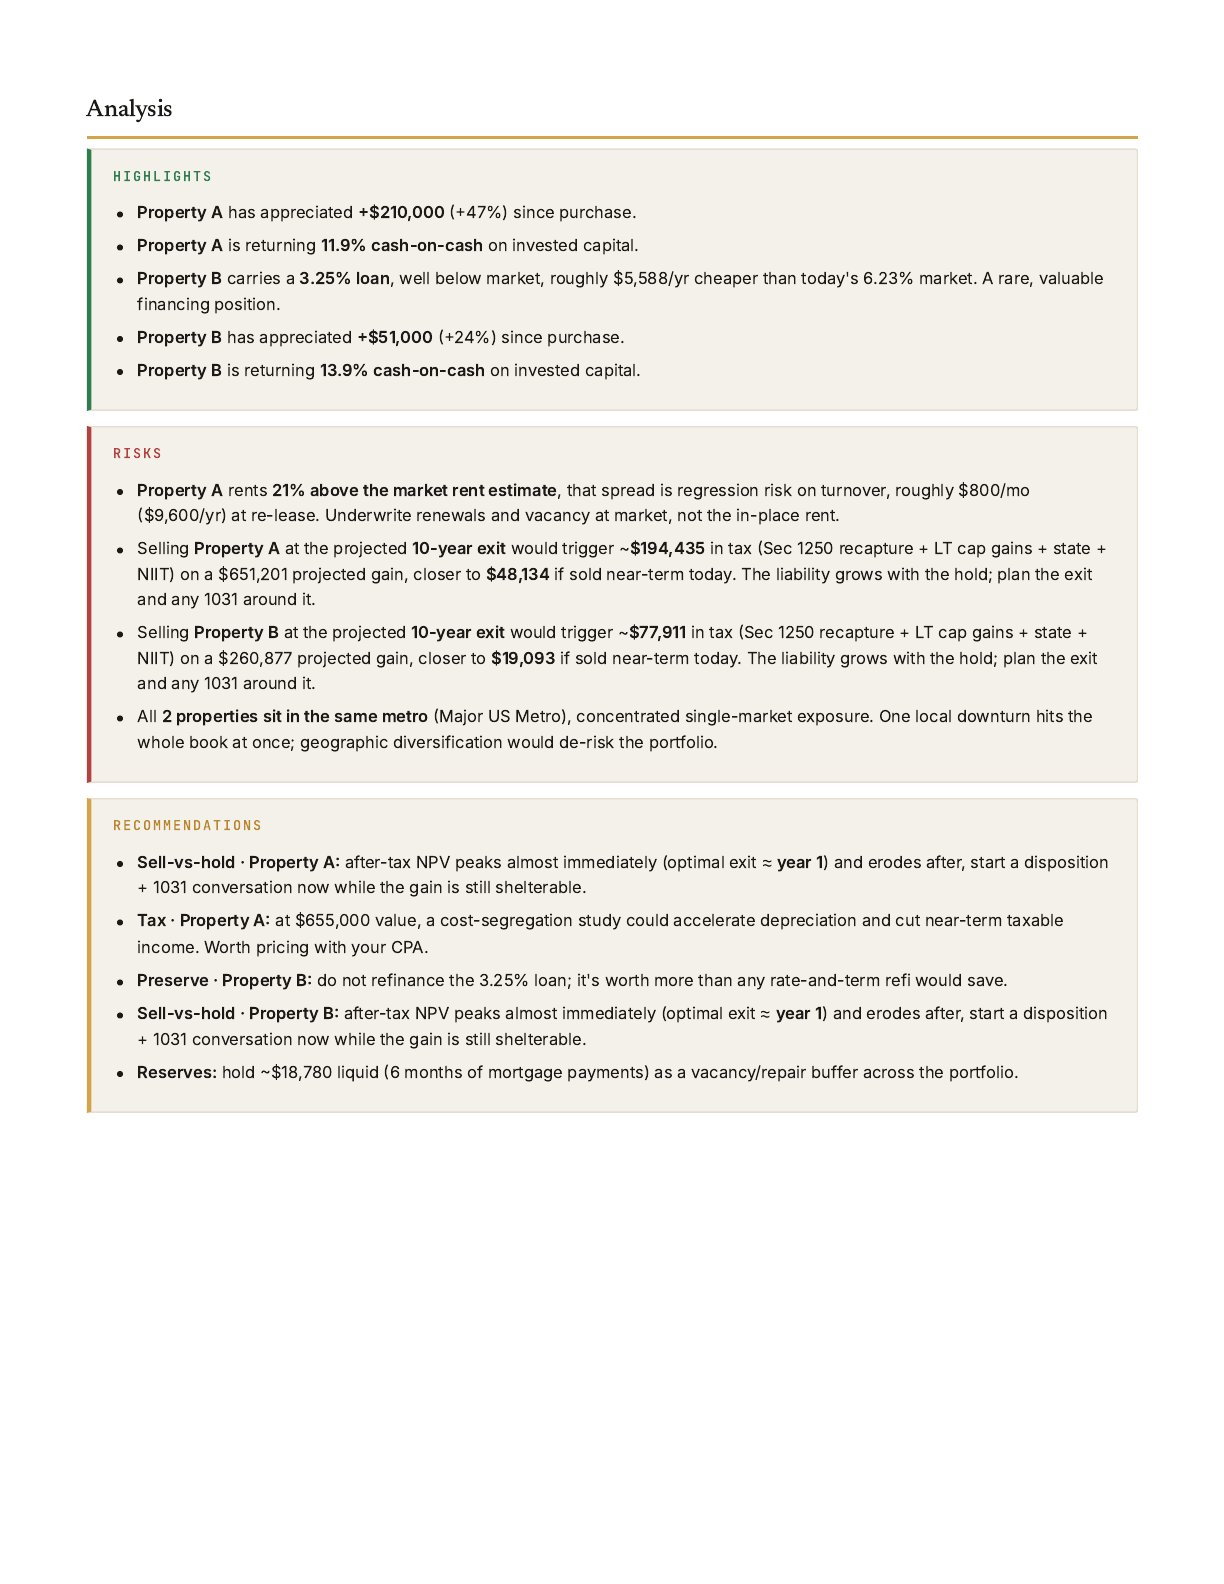
Highlights
- Property B carries a 3.25% loan, well below market, roughly $5,215/yr cheaper than today's 6.23% market. A rare, valuable financing position.
- Property B has appreciated +$100,000 (+50%) since purchase.
- Property B covers its mortgage 1.50×, strong debt-service coverage.
- Property B is returning 22.6% cash-on-cash on invested capital.
- $275,000 of equity across the portfolio (69% blended LTV).
Risks
- Property A nets only $116/mo on a reserve-adjusted basis (5% vacancy/maintenance/CapEx), thin margin for a vacancy or a big repair. Trailing actuals (after real CapEx) run $343/mo, so the property does cover itself, but the buffer is modest.
- Property A has a tight reserve-adjusted DSCR of 1.04 (below the 1.20 lender comfort line). Trailing actual DSCR (after real CapEx) is 1.12.
- Property A rents 31% above the market rent estimate, that spread is regression risk on turnover, roughly $1,000/mo ($12,000/yr) at re-lease. Underwrite renewals and vacancy at market, not the in-place rent.
- Selling Property A at the projected 10-year exit would trigger ~$159,218 in tax (Sec 1250 recapture + LT cap gains + state + NIIT) on a $528,708 projected gain, closer to $25,433 if sold near-term today. The liability grows with the hold; plan the exit and any 1031 around it.
- Selling Property B at the projected 10-year exit would trigger ~$94,199 in tax (Sec 1250 recapture + LT cap gains + state + NIIT) on a $317,530 projected gain, closer to $29,592 if sold near-term today. The liability grows with the hold; plan the exit and any 1031 around it.
Recommendations
- Sell-vs-hold · Property A: after-tax NPV peaks almost immediately (optimal exit ≈ year 1) and erodes after, start a disposition + 1031 conversation now while the gain is still shelterable.
- Preserve · Property B: do not refinance the 3.25% loan; it's worth more than any rate-and-term refi would save.
- Sell-vs-hold · Property B: after-tax NPV peaks almost immediately (optimal exit ≈ year 1) and erodes after, start a disposition + 1031 conversation now while the gain is still shelterable.
- Reserves: hold ~$21,500 liquid (6 months of mortgage payments) as a vacancy/repair buffer across the portfolio.
Property Performance
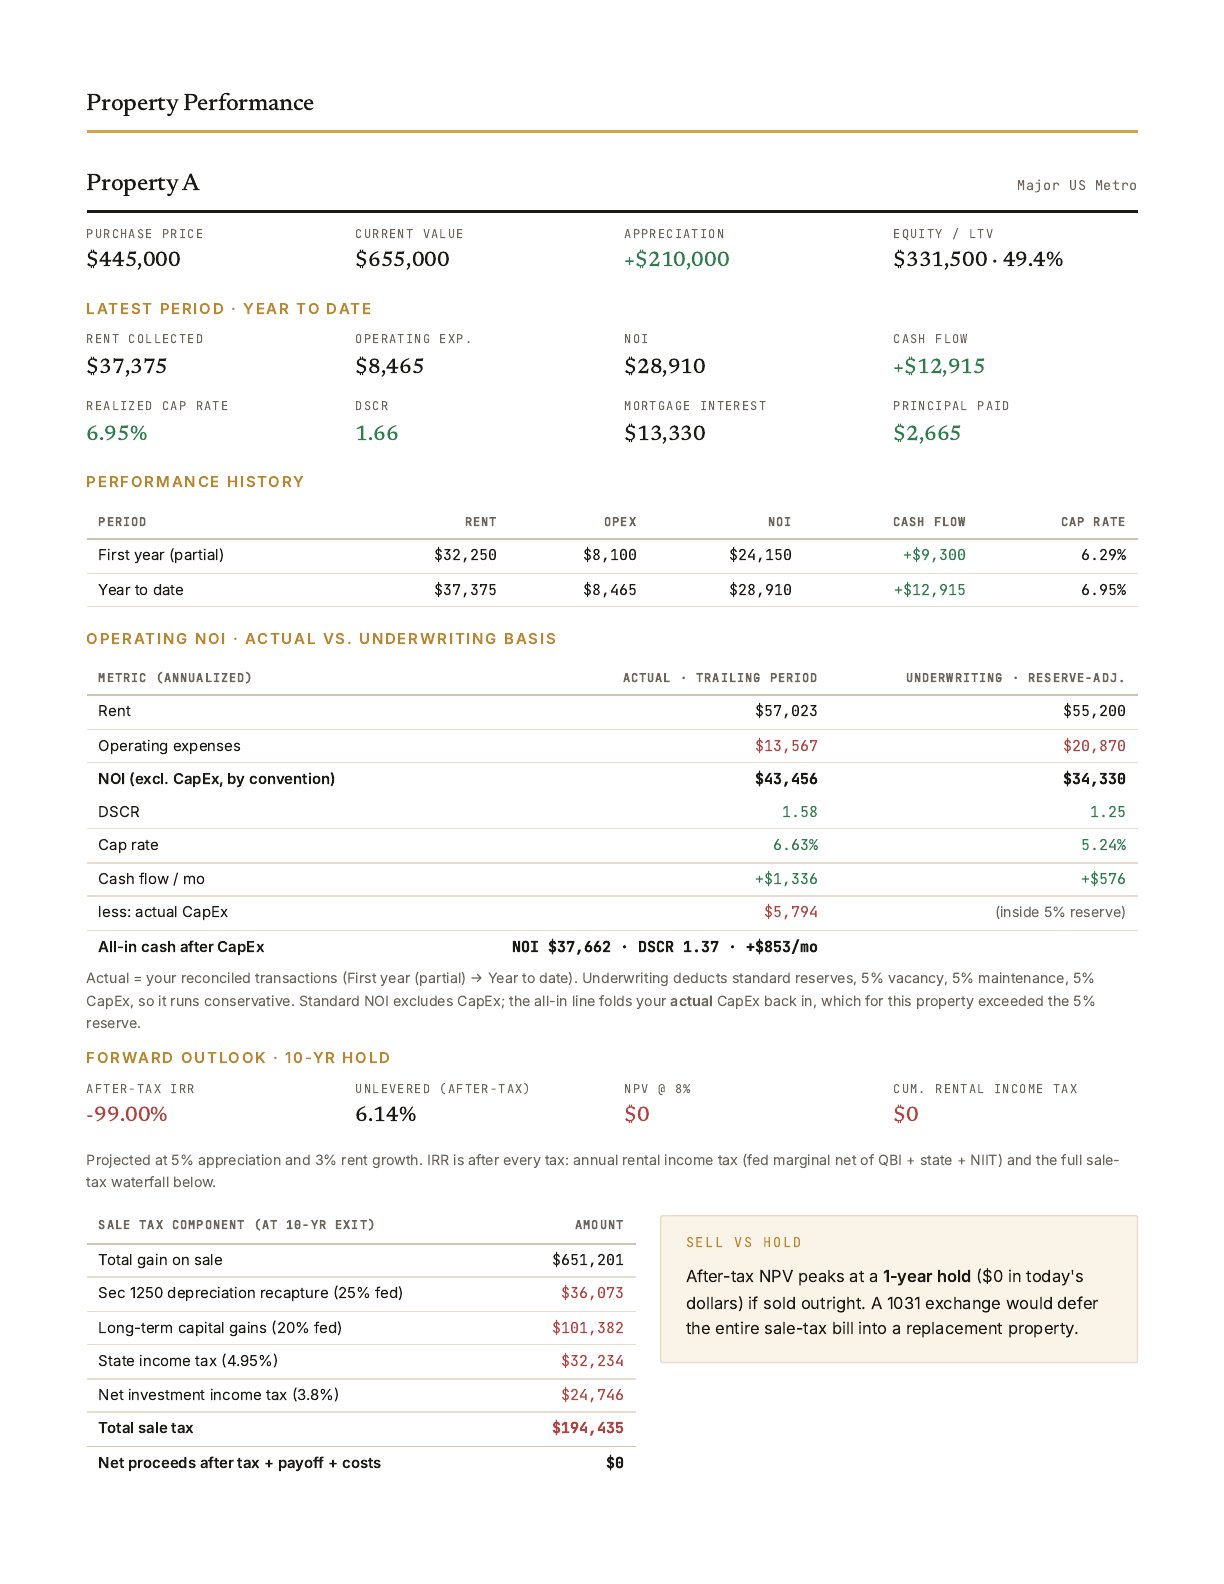
Property A
Major US Metro · ?bd/?ba · ? sqft
Equity / LTV
$150,000 · 73.9%
Latest Period · Year to date
Performance History
| Period | Rent | OpEx | NOI | Cash Flow | Cap Rate |
| First year (partial) |
$31,500 |
$9,209 |
$23,000 |
+$3,422 |
6.64% |
| Year to date |
$31,500 |
$7,837 |
$24,500 |
+$8,147 |
8.28% |
Operating NOI · Actual vs. Underwriting Basis
| Metric (annualized) | Actual · trailing period | Underwriting · reserve-adj. |
| Rent | $57,798 | $50,000 |
| Operating expenses | $15,639 | $23,189 |
| NOI (excl. CapEx, by convention) | $43,578 | $35,000 |
| DSCR | 1.30 | 1.04 |
| Cap rate | 7.58% | 5.95% |
| Cash flow / mo | +$840 | +$116 |
| less: actual CapEx | $5,963 | (inside 5% reserve) |
| All-in cash after CapEx | NOI $37,615 · DSCR 1.12 · +$343/mo | , |
Actual = your reconciled transactions (First year (partial) → Year to date). Underwriting deducts standard reserves, 5% vacancy, 5% maintenance, 5% CapEx, so it runs conservative. Standard NOI excludes CapEx; the all-in line folds your actual CapEx back in, which for this property exceeded the 5% reserve.
Forward Outlook · 10-yr hold
Unlevered (after-tax)
6.83%
Projected at 5% appreciation and 3% rent growth. IRR is after every tax: annual rental income tax (fed marginal net of QBI + state + NIIT) and the full sale-tax waterfall below.
| Sale tax component (at 10-yr exit) | Amount |
| Total gain on sale | $528,708 |
| Sec 1250 depreciation recapture (25% fed) | $36,073 |
| Long-term capital gains (20% fed) | $76,884 |
| State income tax (4.95%) | $26,171 |
| Net investment income tax (3.8%) | $20,091 |
| Total sale tax | $159,218 |
| Net proceeds after tax + payoff + costs | $0 |
Sell vs Hold
After-tax NPV peaks at a 1-year hold ($0 in today's dollars) if sold outright.
A 1031 exchange would defer the entire sale-tax bill into a replacement property.
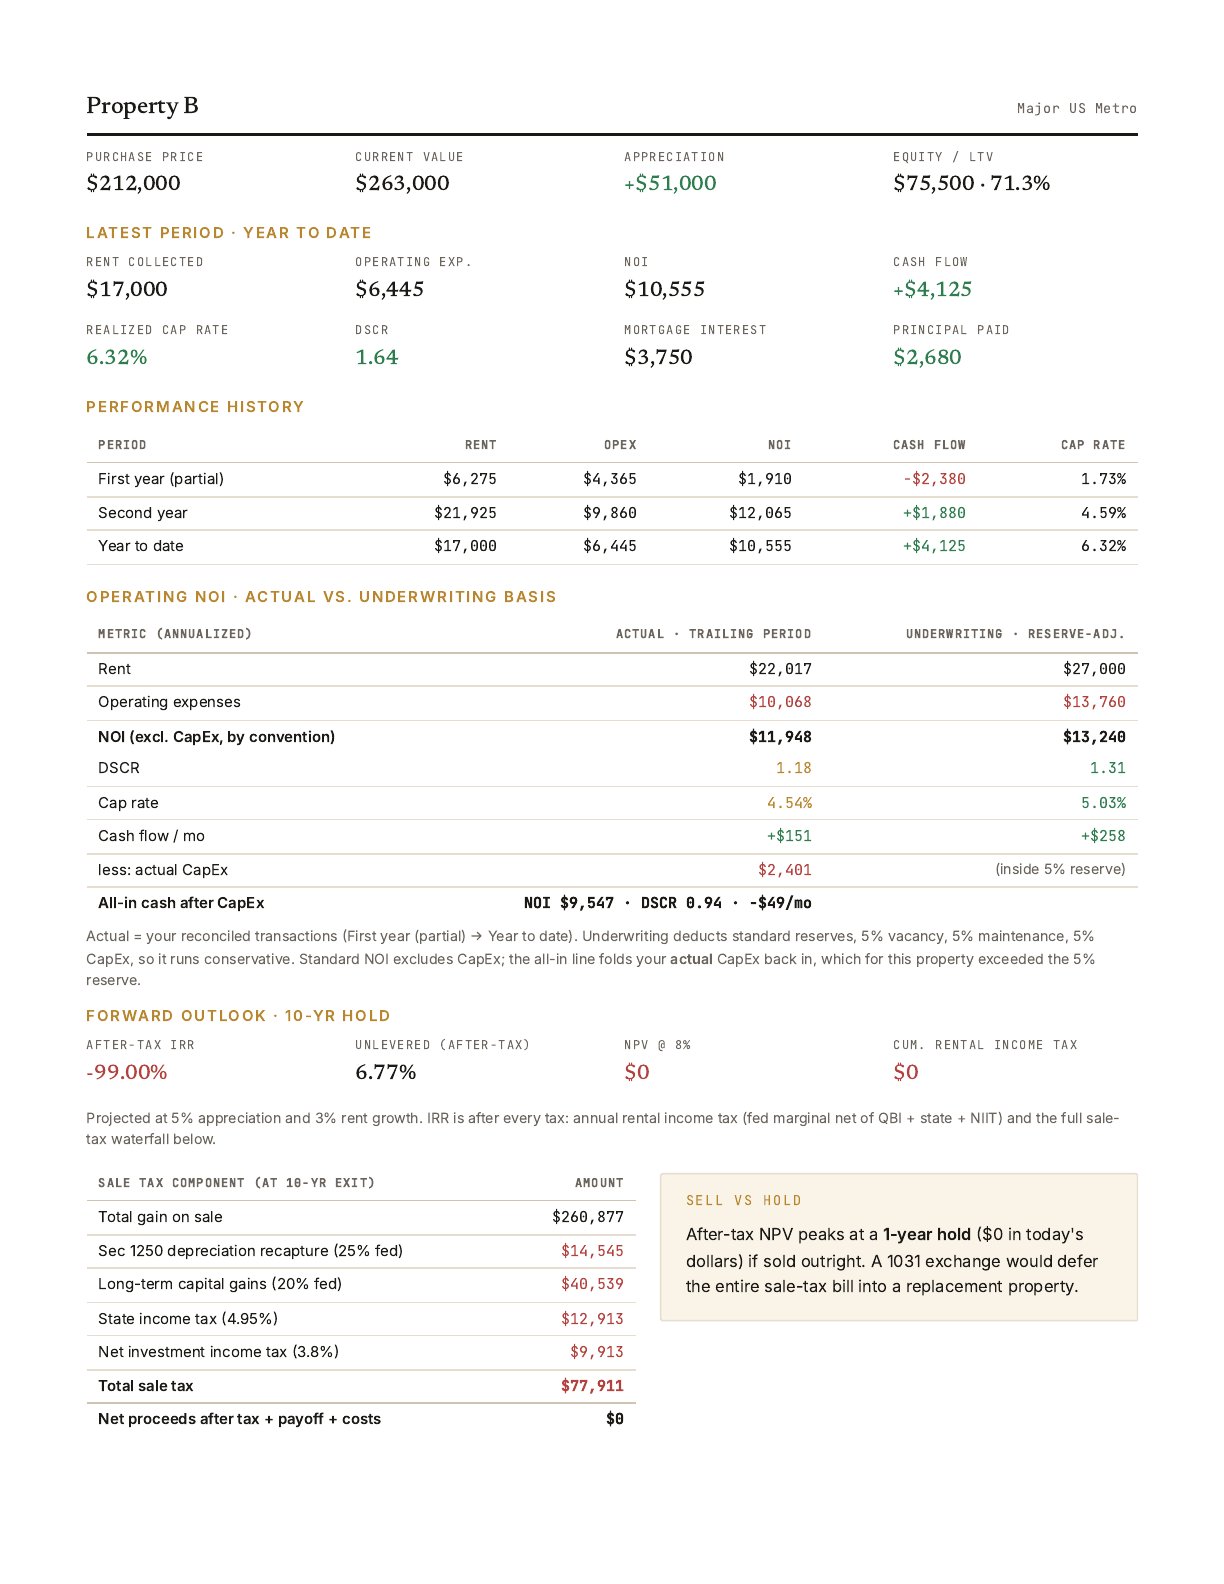
Property B
Major US Metro · ?bd/?ba · ? sqft
Equity / LTV
$125,000 · 58.3%
Latest Period · Year to date
Performance History
| Period | Rent | OpEx | NOI | Cash Flow | Cap Rate |
| First year (partial) |
$7,000 |
$4,967 |
$2,500 |
−$1,523 |
1.97% |
| Second year |
$24,500 |
$10,753 |
$14,500 |
+$5,515 |
4.74% |
| Year to date |
$16,500 |
$5,461 |
$11,500 |
+$7,132 |
7.36% |
Operating NOI · Actual vs. Underwriting Basis
| Metric (annualized) | Actual · trailing period | Underwriting · reserve-adj. |
| Rent | $24,974 | $28,500 |
| Operating expenses | $11,020 | $15,351 |
| NOI (excl. CapEx, by convention) | $14,828 | $14,000 |
| DSCR | 1.56 | 1.50 |
| Cap rate | 4.94% | 4.62% |
| Cash flow / mo | +$444 | +$396 |
| less: actual CapEx | $2,081 | (inside 5% reserve) |
| All-in cash after CapEx | NOI $12,747 · DSCR 1.34 · +$271/mo | , |
Actual = your reconciled transactions (First year (partial) → Year to date). Underwriting deducts standard reserves, 5% vacancy, 5% maintenance, 5% CapEx, so it runs conservative. Standard NOI excludes CapEx; the all-in line folds your actual CapEx back in, which for this property exceeded the 5% reserve.
Forward Outlook · 10-yr hold
Unlevered (after-tax)
6.08%
Projected at 5% appreciation and 3% rent growth. IRR is after every tax: annual rental income tax (fed marginal net of QBI + state + NIIT) and the full sale-tax waterfall below.
| Sale tax component (at 10-yr exit) | Amount |
| Total gain on sale | $317,530 |
| Sec 1250 depreciation recapture (25% fed) | $14,545 |
| Long-term capital gains (20% fed) | $51,870 |
| State income tax (4.95%) | $15,718 |
| Net investment income tax (3.8%) | $12,066 |
| Total sale tax | $94,199 |
| Net proceeds after tax + payoff + costs | $0 |
Sell vs Hold
After-tax NPV peaks at a 1-year hold ($0 in today's dollars) if sold outright.
A 1031 exchange would defer the entire sale-tax bill into a replacement property.
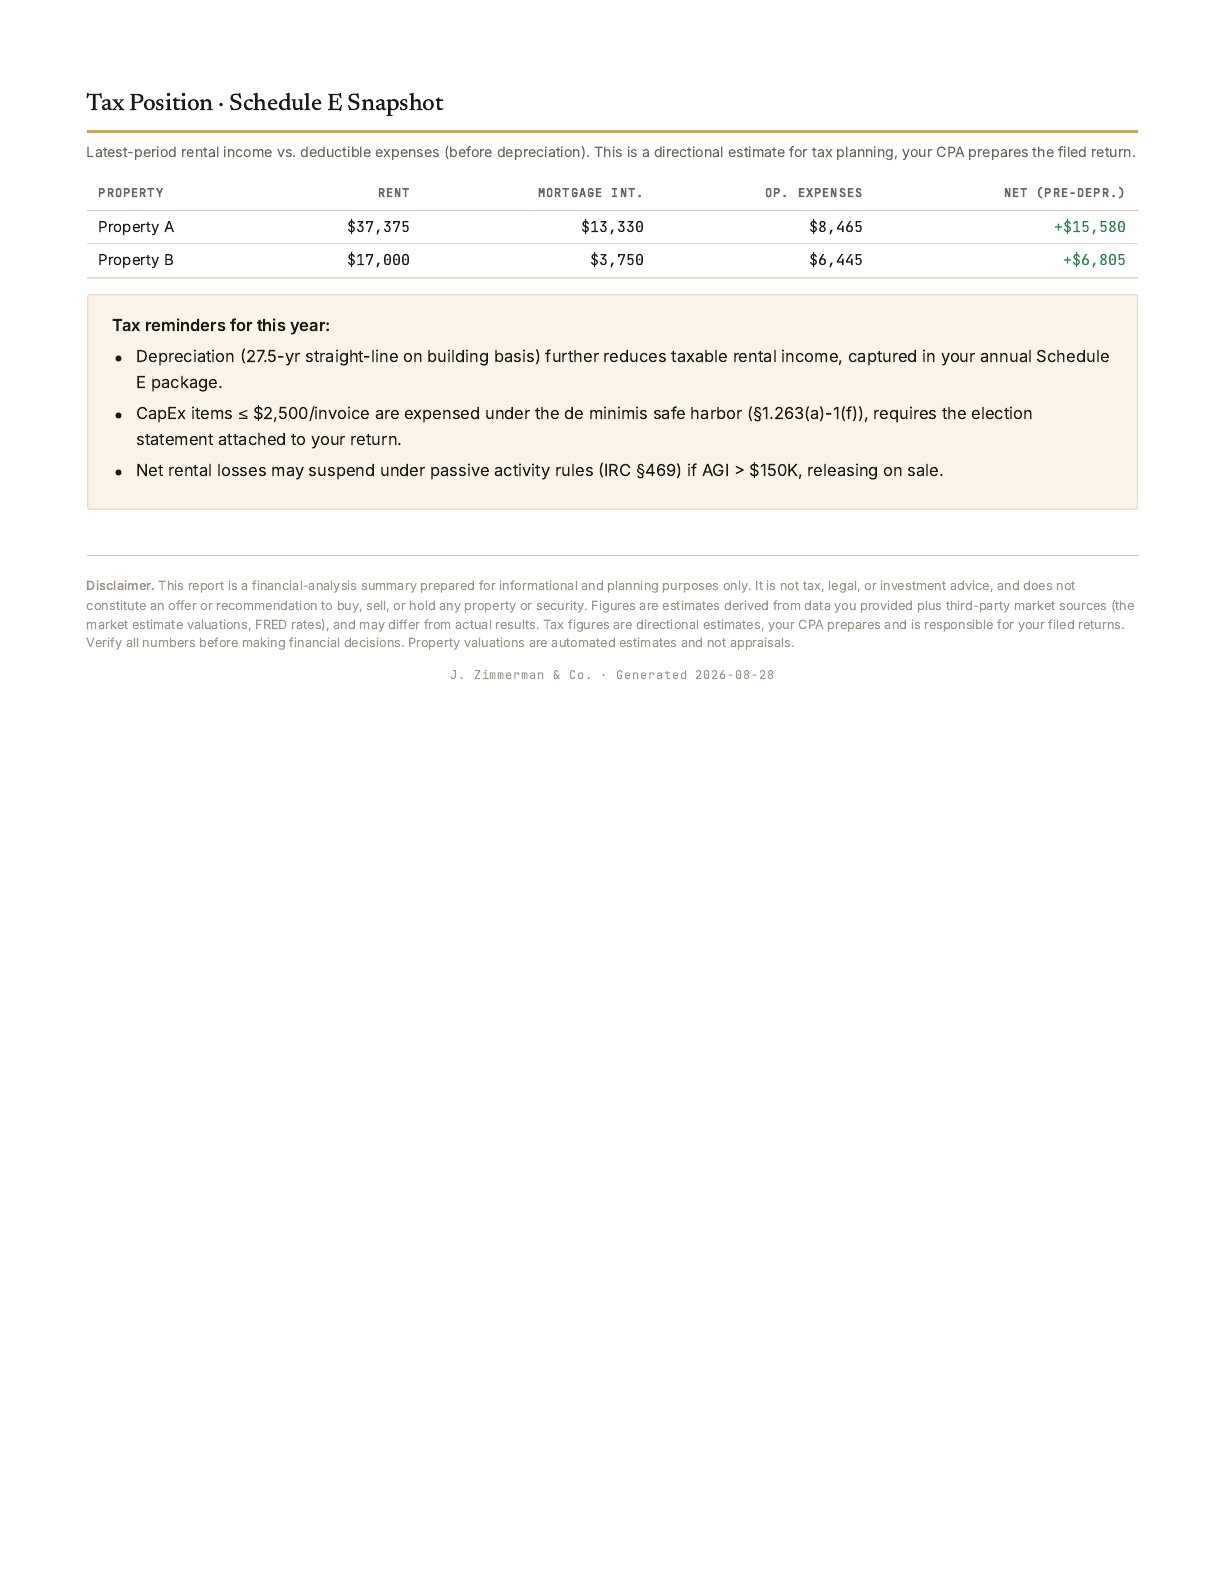
Tax Position · Schedule E Snapshot
Latest-period rental income vs. deductible expenses (before depreciation). This is a directional estimate for tax planning, your CPA prepares the filed return.
| Property | Rent | Mortgage Int. | Op. Expenses | Net (pre-depr.) |
| Property A |
$31,500 |
$14,633 |
$7,837 |
+$9,030 |
| Property B |
$16,500 |
$2,702 |
$5,461 |
+$8,337 |
Tax reminders for this year:
- Depreciation (27.5-yr straight-line on building basis) further reduces taxable rental income, captured in your annual Schedule E package.
- CapEx items ≤ $2,500/invoice are expensed under the de minimis safe harbor (§1.263(a)-1(f)), requires the election statement attached to your return.
- Net rental losses may suspend under passive activity rules (IRC §469) if AGI > $150K, releasing on sale.
Disclaimer. This report is a financial-analysis summary prepared for informational and planning
purposes only. It is not tax, legal, or investment advice, and does not constitute an offer or recommendation to
buy, sell, or hold any property or security. Figures are estimates derived from data you provided plus third-party
market sources (the market estimate valuations, FRED rates), and may differ from actual results. Tax figures are directional
estimates, your CPA prepares and is responsible for your filed returns. Verify all numbers before making
financial decisions. Property valuations are automated estimates and not appraisals.